
Blog
How to Read an HPLC Chromatogram: Complete Research Guide

High-performance liquid chromatography (HPLC) is one of the most widely used analytical techniques for separating, detecting, and quantifying components within a sample.
For researchers reviewing analytical documentation, however, an HPLC chromatogram can initially look like little more than a collection of peaks on a graph.
Those peaks contain useful information.
Understanding retention time, peak area, baseline behavior, minor peaks, and calculated purity can help researchers interpret HPLC data more accurately and understand what laboratory documentation actually demonstrates.
This guide explains the fundamental components of an HPLC chromatogram and, just as importantly, what conclusions should not be drawn from
HPLC purity data alone.
What Is an HPLC Chromatogram?
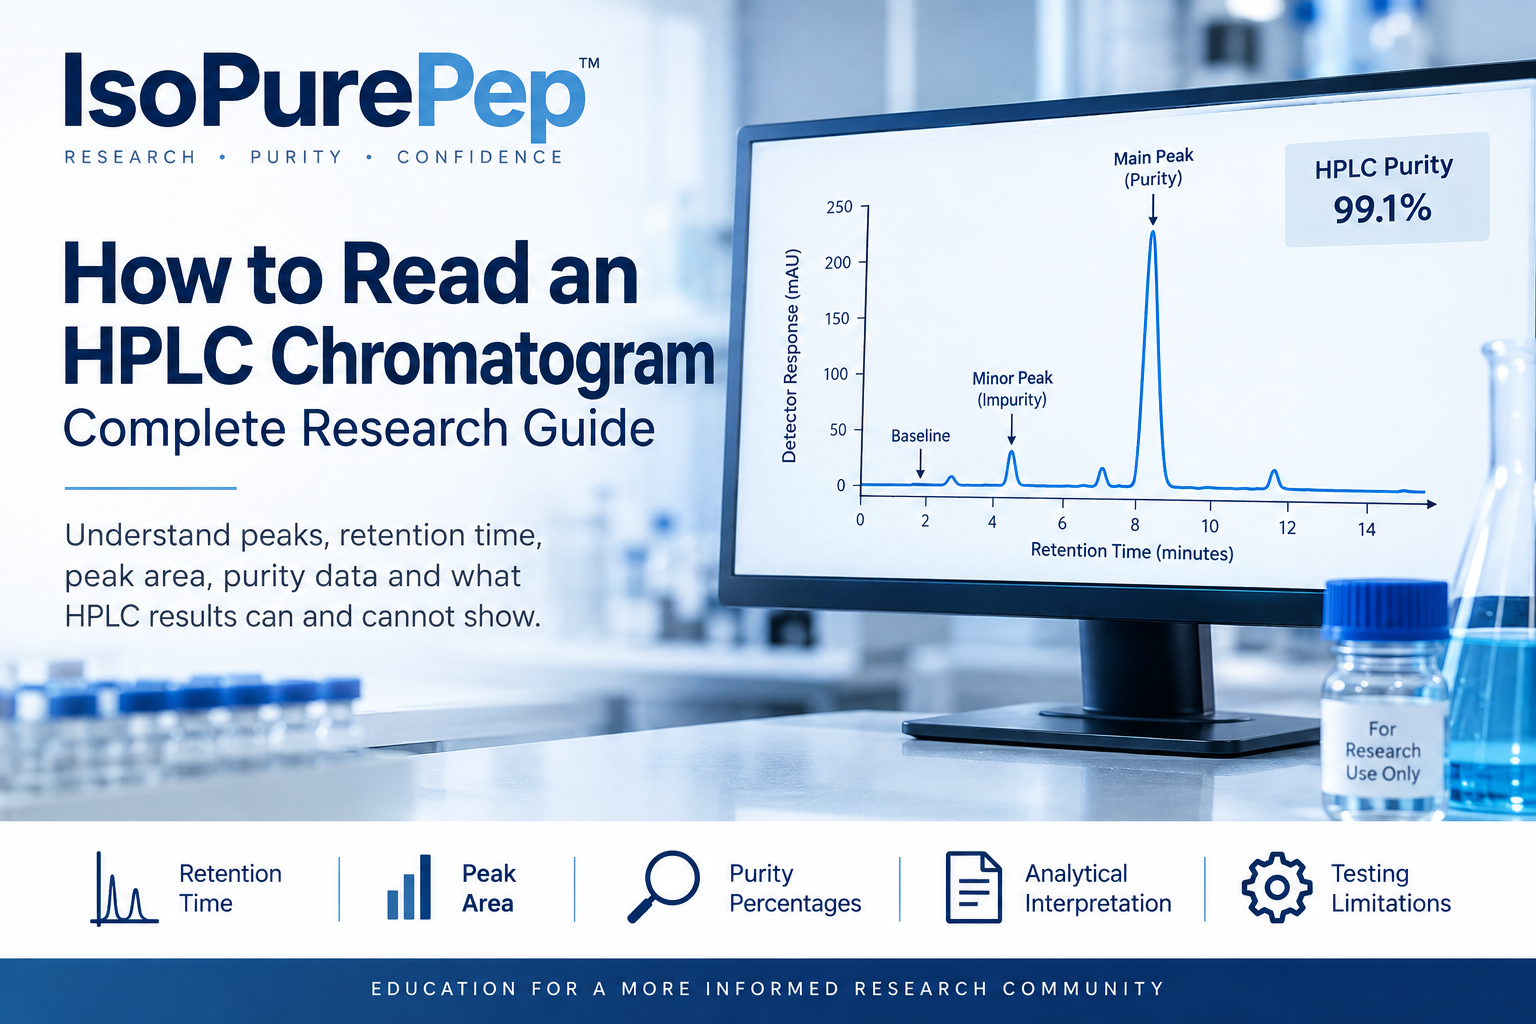
An HPLC chromatogram is the graphical output produced during an HPLC analysis.
The horizontal X-axis normally represents time, commonly expressed in minutes.
The vertical Y-axis represents detector response.
As compounds travel through the chromatography system, different components may reach the detector at different times. When the detector registers a component, a peak appears on the chromatogram.
The resulting pattern helps analysts evaluate the composition of the sample under the conditions of that particular analytical method.
1. Retention Time
Retention time, often abbreviated RT, describes how long it takes a detected component to travel through the chromatographic system and reach the detector.
For example, a chromatogram could contain a major peak at:
RT = 7.42 minutes
Retention time can be useful when comparing an analytical sample with an appropriate reference standard under controlled conditions.
However, retention time by itself does not conclusively establish molecular identity.
Method conditions—including the column, solvents, flow rate, temperature and gradient—can influence retention behavior.
2. The Main Peak
The largest relevant peak in a chromatogram commonly represents the predominant detected component under the analytical conditions being used.
If one peak accounts for the overwhelming majority of the integrated detector response, the laboratory may report a high chromatographic purity percentage.
For example:
Main peak area: 99.3%
That generally means approximately 99.3% of the integrated area included in that chromatographic calculation was attributed to the main peak.
It should not automatically be interpreted as:
“The vial contains exactly 99.3% of the expected compound.”
Those are different claims.
3. Peak Area
Software can integrate the area underneath individual chromatographic peaks.
Analysts may then compare the area of the principal peak with the combined integrated areas of other relevant peaks.
A simplified calculation might look like:
Main Peak Area ÷ Total Integrated Peak Area × 100
For example, if the principal peak represents 99.1% of the total relevant integrated area, a report might show:
Purity by HPLC: 99.1%
The laboratory’s actual calculation can depend on its validated method, integration parameters and reporting procedures.
4. Minor Peaks
Smaller peaks can appear in addition to the primary peak.
Depending on the sample and analytical method, these signals may correspond to impurities, degradation products, synthesis-related components, solvents or other detectable substances.
A minor peak does not automatically identify what produced it.
Additional analytical techniques may be necessary to characterize an unknown component.
This distinction is important when interpreting a Certificate of Analysis.
5. The Baseline
The baseline is the detector signal when no significant analyte peak is being recorded.
A stable baseline helps distinguish meaningful chromatographic peaks from background detector noise.
Baseline drift, noise or other irregularities can sometimes make integration more complicated.
This is one reason researchers should consider the complete chromatogram rather than focusing exclusively on a purity percentage printed on a report.
6. What Does “99% Purity” Actually Mean?
This is one of the most important concepts to understand.
If a COA reports:
HPLC Purity: 99.0%
it generally describes the result of a particular chromatographic analysis performed using a particular method.
It does not, by itself, establish every characteristic of the material.
A high HPLC area percentage should not automatically be interpreted as proof of:
- molecular identity
- exact quantity or concentration
- sterility
- endotoxin status
- absence of every possible contaminant
- safety
- effectiveness
- regulatory approval
- suitability for human or animal use
Those questions require different evidence and, depending upon the question, different analytical methods.
HPLC Purity vs. Molecular Identity
This distinction is especially important when evaluating research materials.
Purity testing asks:
How much of the detected chromatographic response corresponds to the primary component?
Identity testing asks:
Is the material actually the compound it is represented to be?
These questions are related but not identical.
Mass spectrometry is one analytical technique commonly used to provide information about molecular mass and can therefore contribute to identity characterization.
For stronger analytical documentation, researchers may encounter multiple complementary testing methods rather than relying solely on an HPLC purity percentage.
HPLC vs. Mass Spectrometry
HPLC and mass spectrometry provide different types of analytical information.
HPLC is particularly useful for separation and chromatographic purity analysis.
Mass spectrometry (MS) provides information related to the mass-to-charge ratios of detected ions and can help characterize molecular identity.
The techniques can also be combined as LC-MS, allowing chromatographic separation and mass analysis to be performed together.
Therefore, a research COA containing both chromatographic and mass-analysis information may provide more information than a purity percentage alone.
Researchers working with freeze-dried materials can also review our guide to lyophilized peptides and reference standards for additional context on purity results, COAs, and lot-specific documentation.
What Researchers Should Look for on an HPLC Report
When reviewing HPLC documentation, consider more than the number next to “purity.”
Look for information such as the sample or lot identifier, test date, analytical method, retention time, chromatogram, integration results, reported purity and laboratory identification.
Researchers should also determine whether the documentation corresponds to the specific lot being evaluated.
A generic report that cannot be connected to a particular lot provides less traceability than clearly identified lot-specific documentation.
Why Method Information Matters
HPLC results depend upon analytical conditions.
Important variables can include:
Column chemistry
Mobile phase
Gradient
Flow ratehow
Detection wavelength
Injection volume
Column temperature
Run time
Sample preparation
Changing analytical conditions can alter how compounds separate and appear on the chromatogram.
Consequently, chromatograms should be interpreted within the context of the method that produced them.
What HPLC Cannot Establish by Itself
HPLC is an extremely useful analytical technique, but it has defined limitations.
An HPLC chromatogram alone does not establish that a material is FDA approved, safe, clinically effective or appropriate for administration.
Likewise, chromatographic purity is not equivalent to sterility or biological safety.
Understanding these limitations helps prevent analytical data from being interpreted beyond what the testing actually demonstrates.
How HPLC Information Appears on a COA
A Certificate of Analysis may summarize laboratory testing performed on a particular sample or lot.
Depending upon the laboratory and testing performed, a COA could include:
Lot number
Sample identification
Testing date
HPLC purity
Retention time
Chromatogram
Mass analysis
Analytical observations
Laboratory information
Researchers should evaluate the complete document rather than relying solely on a prominently displayed purity percentage.
The Bottom Line
An HPLC chromatogram provides a visual representation of how components in a sample were separated and detected under a defined analytical method.
The most important concepts to understand are:
Retention time — when a detected component reaches the detector.
Peak area — the integrated detector response associated with a peak.
Main peak — usually the predominant detected component.
Minor peaks — additional detector responses requiring appropriate interpretation.
Purity percentage — a chromatographic calculation, not universal proof of identity, sterility, safety or suitability.
Understanding these distinctions allows researchers to evaluate analytical documentation more critically and avoid drawing conclusions that the data itself does not support.
For research and educational information only. This article does not provide medical advice or establish the safety, effectiveness, regulatory status, or suitability of any material for human or animal use.